Berkas:Prime number theorem ratio convergence.svg
Loncat ke navigasi
Loncat ke pencarian

Ukuran pratayang PNG ini dari berkas SVG ini: 250 × 160 piksel Resolusi lainnya: 320 × 205 piksel | 640 × 410 piksel | 1.024 × 655 piksel | 1.280 × 819 piksel | 2.560 × 1.638 piksel.
Ukuran asli (Berkas SVG, secara nominal 250 × 160 piksel, besar berkas: 87 KB)
Ringkasan
| Deskripsi |
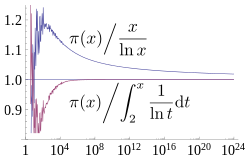
English: A plot showing how two estimates described by the prime number theorem, and converge asymptotically towards , the number of primes less than x. The x axis is and is logarithmic (labelled in evenly spaced powers of 10), going up to 1024, the largest for which is currently known. The former estimate converges extremely slowly, while the latter has visually converged on this plot by 108. Source used to generate this chart is shown below. |
| Tanggal | |
| Sumber | Karya sendiri |
| Pembuat | Dcoetzee |
| SVG genesis |


Lisensi
Saya, pemilik hak cipta dari karya ini, dengan ini menerbitkan berkas ini di bawah ketentuan berikut:
| Berkas ini dilepaskan di bawah CC0 1.0 Dedikasi Domain Publik Universal Creative Commons. | |
| Orang yang mengaitkan suatu karya dengan dokumen ini telah mendedikasikan karyanya sebagai domain publik dengan mengabaikan semua hak ciptanya di seluruh dunia menurut hukum hak cipta, termasuk semua hak yang terkait dan berhubungan, sejauh yang diakui hukum. Anda dapat menyalin, menyebarkan, dan mempertunjukkan karya, bahkan untuk tujuan komersial, tanpa meminta izin.
|
Source
All source released under CC0 waiver.
Mathematica source to generate graph (which was then saved as SVG from Mathematica):
(* Sample both functions at 600 logarithmically spaced points between \
1 and 2^40 *)
base = N[E^(24 Log[10]/600)];
ratios = Table[{Round[base^x],
    N[PrimePi[Round[base^x]]/(base^x/(x*Log[base]))]}, {x, 1,
    Floor[40/Log[2, base]]}];
ratiosli =
  Table[{Round[base^x],
    N[PrimePi[
       Round[base^x]]/(LogIntegral[base^x] - LogIntegral[2])]}, {x,
    Ceiling[Log[base, 2]], Floor[40/Log[2, base]]}];
(* Supplement with larger known PrimePi values that are too large for \
Mathematica to compute *)
LargePiPrime = {{10^13, 346065536839}, {10^14, 3204941750802}, {10^15,
     29844570422669}, {10^16, 279238341033925}, {10^17,
    2623557157654233}, {10^18, 24739954287740860}, {10^19,
    234057667276344607}, {10^20, 2220819602560918840}, {10^21,
    21127269486018731928}, {10^22, 201467286689315906290}, {10^23,
    1925320391606803968923}, {10^24, 18435599767349200867866}};
ratios2 =
  Join[ratios,
   Map[{#[[1]], N[#[[2]]]/(#[[1]]/(Log[#[[1]]]))} &, LargePiPrime]];
ratiosli2 =
  Join[ratiosli,
   Map[{#[[1]], N[#[[2]]]/(LogIntegral[#[[1]]] - LogIntegral[2])} &,
    LargePiPrime]];
(* Plot with log x axis, together with the horizontal line y=1 *)
Show[LogLinearPlot[1, {x, 1, 10^24}, PlotRange -> {0.8, 1.25}],
 ListLogLinearPlot[{ratios2, ratiosli2}, Joined -> True],
 LabelStyle -> FontSize -> 14]
LaTeX source for labels:
$$ \left.{\pi(x)}\middle/{\frac{x}{\ln x}}\right. $$
$$ \left.{\pi(x)}\middle/{\int_2^x \frac{1}{\ln t} \mathrm{d}t}\right. $$
These were converted to SVG with [1] and then the graph was embedded into the resulting document in Inkscape. Axis fonts were also converted to Liberation Serif in Inkscape.
Riwayat berkas
Klik pada tanggal/waktu untuk melihat berkas ini pada saat tersebut.
| Tanggal/Waktu | Miniatur | Dimensi | Pengguna | Komentar | |
|---|---|---|---|---|---|
| terkini | 21 Maret 2013 14.07 | | 250 × 160 (87 KB) | wikimediacommons>Dcoetzee | Change n to x to match article |
Penggunaan berkas
Halaman berikut menggunakan berkas ini: