Berkas:Isotopes and half-life.PNG
Loncat ke navigasi
Loncat ke pencarian
Ukuran pratayang ini: 518 × 599 piksel. Resolusi lainnya: 207 × 240 piksel | 415 × 480 piksel | 640 × 740 piksel.
Ukuran asli (640 × 740 piksel, ukuran berkas: 40 KB, tipe MIME: image/png)
Ringkasan
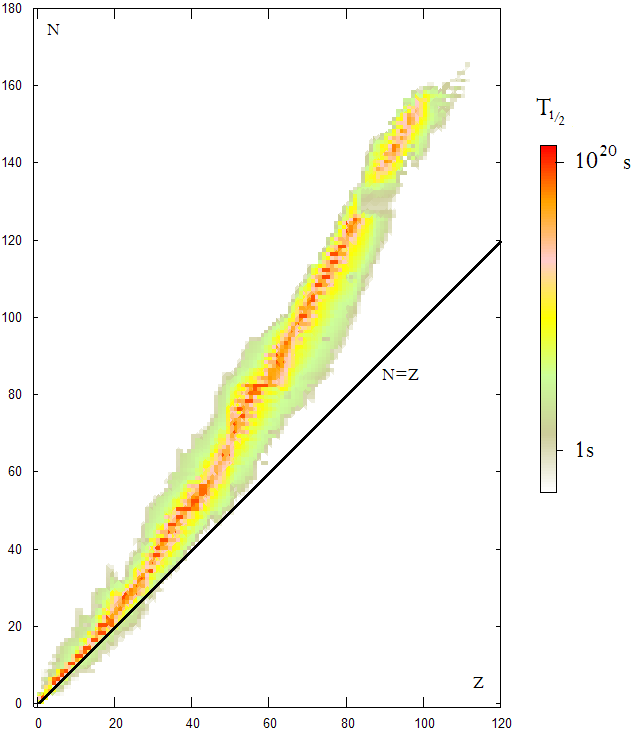
The Nuclear Chart which represent every known nucleus, stable and unstable. Plotted as Z (number of protons) versus N (number of neutrons). The color corresponds to the value of the half-life T½ with a strong log scale, as it varies between and seconds.


[]
SVG:
-
 Inggris
 -
 Esperanto
 -
 Belanda
 -
 Rusia
Rusia


PNG:
-
 Inggris
 -


Lisensi
| Saya, pemegang hak cipta karya ini, merilis karya ini ke domain umum. Lisensi ini berlaku di seluruh dunia. Di sejumlah negara, tindakan ini tidak memungkinkan secara sah; bila seperti itu: Saya memberikan siapa pun hak untuk menggunakan karya ini untuk tujuan apa pun, tanpa persyaratan apa pun, kecuali yang ditetapkan oleh hukum. |
Riwayat berkas
Klik pada tanggal/waktu untuk melihat berkas ini pada saat tersebut.
| Tanggal/Waktu | Miniatur | Dimensi | Pengguna | Komentar | |
|---|---|---|---|---|---|
| terkini | 19 Oktober 2006 21.50 | | 640 × 740 (40 KB) | wikimediacommons>Fffred~commonswiki | Graph of the stability of every known nucleus. Plotted as Z (number of protons) versus N (number of neutrons). The color corresponds to the value of the half-life <math>T_{1/2}</math> |
Penggunaan berkas
Tidak ada halaman yang menggunakan berkas ini.